Posting consistently is only half the job. The other half is understanding what's actually working, and using that information to get better every single week.
Most social media managers either skip analytics entirely, or they check them so infrequently that the data is useless by the time they look. The ones who grow fast do something different: they check their numbers regularly, identify patterns, and let the data shape what they create next.
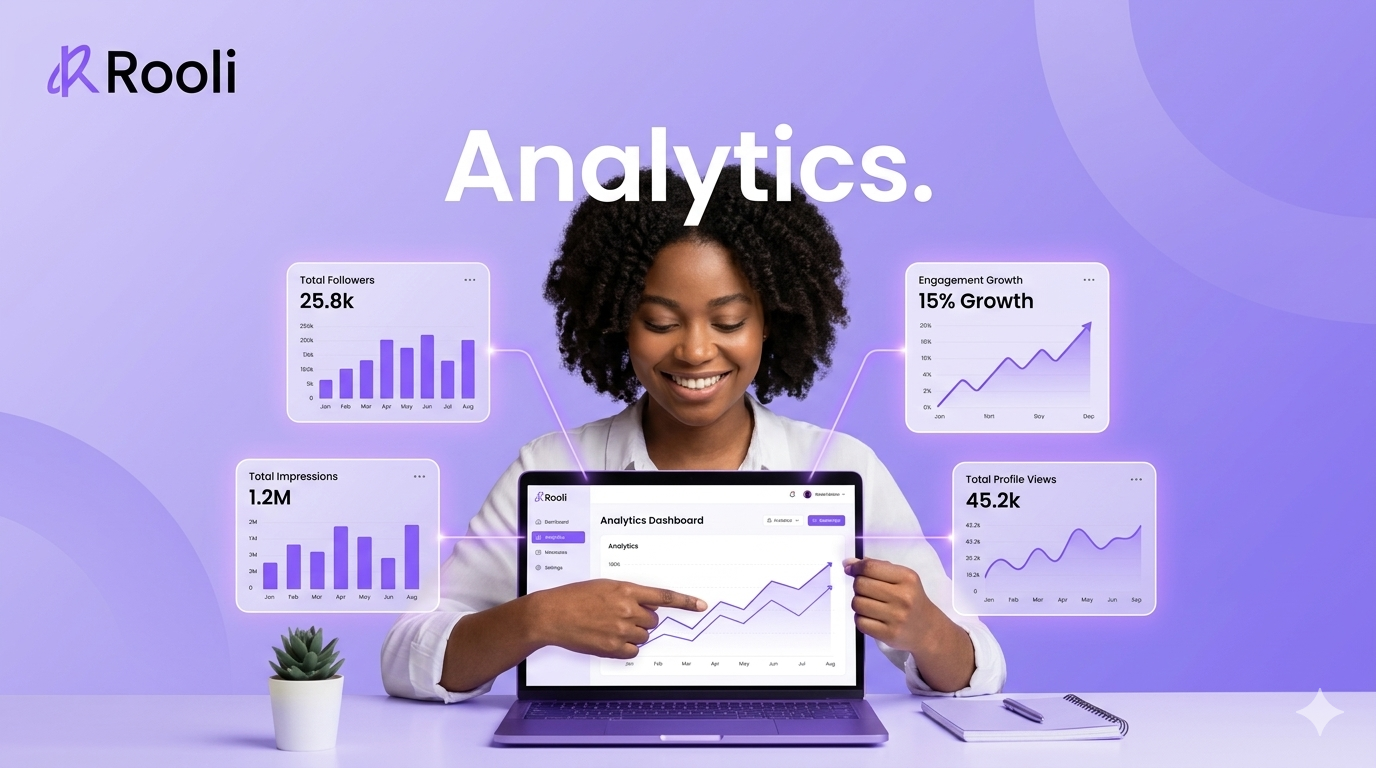
Rooli's Analytics dashboard puts everything you need in one place, across all your connected platforms, filterable by date and by platform, with charts that make patterns obvious at a glance. This guide walks you through exactly how to use it.
What You'll Need Before You Start
To get meaningful data from Rooli's Analytics dashboard, you'll need:
• An active Rooli account with at least one social media account connected
• At least a week of published posts, analytics need content to measure
• A clear idea of what you're trying to track, growth, engagement, reach, or top content
💡 Pro Tip: The more consistently you post, the more useful your analytics become. A month of regular posting gives you enough data to spot real patterns, not just random spikes.
How to Access Your Analytics Dashboard
From your Rooli dashboard, click Analytics in the sidebar. You'll land on your analytics homepage, a clean, scrollable view of all your key performance data across every connected platform.
At the top of the page you'll see two important controls:
Date Range Filter
Set a From and To date to define the period you want to analyse. You can look at a single day, a specific week, a full month, or any custom range. This flexibility means you can compare performance week-over-week or month-over-month without any manual calculation.
Platform Filter
Below the date range, you'll see platform buttons: All Platforms, Facebook, Instagram, Twitter/X, LinkedIn, and TikTok. Click any platform to filter your entire analytics view to that platform only. Click All Platforms to see your combined performance across everything at once.
💡 Pro Tip: Start every analytics session by selecting All Platforms to get the full picture. Then switch to individual platform filters to dig deeper into where your best performance is coming from.
Understanding Your Four Key Metrics
Just below the platform filter, Rooli displays four metric cards — your top-line performance numbers for the selected date range and platform. Here's what each one means and why it matters:
Total Followers
The total number of followers across your connected accounts for the selected platform and date range. This is your audience size, the number of people who have chosen to receive your content. Track this week over week to monitor whether your audience is growing, flat, or declining.
Total Profile Views
How many times your profile was visited during the selected period. A high profile view count with low follower growth means people are checking you out but not converting, which is a signal to review your bio, your pinned content, and your overall profile presentation.
Total Impressions
The total number of times your content was displayed on someone's screen during the selected period. Impressions measure reach, how far your content is travelling. A growing impressions number with flat engagement means your content is being seen but not resonating. A growing impressions number with growing engagement means everything is working.
Engagement Growth
The change in total engagement, likes, comments, shares, saves, and clicks, during the selected period compared to the previous equivalent period. This is one of the most important metrics on the page. Engagement growth tells you whether your content is connecting with your audience or just appearing in their feeds.
💡 Pro Tip: Don't obsess over follower count alone. Engagement Growth is a far more reliable signal of content quality and audience connection. An account with 500 highly engaged followers is more valuable than one with 5,000 passive ones.
Reading Your Analytics Charts
Below the four metric cards, Rooli displays three charts that give you a deeper view of your performance over time. Here's how to read each one:
Top Posts Metrics Comparison
This chart compares your top performing posts across different platforms, showing which content drove the most engagement. Use the dropdown on the right to switch between metrics, Engagements, Impressions, Clicks, and more. The platform colour legend at the bottom shows Instagram, Facebook, Twitter, LinkedIn, and TikTok in their respective colours so you can see at a glance which platforms your best content is coming from.
Use this chart to answer one question: what type of content consistently appears here? If carousels keep showing up, make more carousels. If video dominates, prioritise video. Let your top posts tell you what to make next.
Follower Growth
A line chart tracking your follower count over time. Look for upward trends after specific posts or campaigns, these are your growth moments. Look for flat periods and ask what was different about the content during those weeks. The Followers legend at the bottom shows the overall growth line across all connected platforms.
Platform Performance Bar Chart
A bar chart comparing Engagements, Clicks, and Impressions across all your connected platforms simultaneously. This is your platform comparison view, it tells you which platforms are delivering the most value for your content right now. If LinkedIn is driving 3x more engagement than Facebook, that's information. Invest more there.
Top Performing Posts
At the bottom of the Analytics dashboard, Rooli shows your Top Performing Posts, your highest-activity content, filterable by platform using the dropdown on the right. Switch between Facebook, Instagram, TikTok, LinkedIn, and Twitter/X to see which posts performed best on each individual platform.
This section answers the most practical question in social media management: what should I make more of? Study your top posts every week. Look for:
• Format — was it a video, a carousel, a single image, or a text post?
• Topic — what was the post about? A tip, a product, a question, a story?
• Tone — was it educational, funny, emotional, conversational?
• Timing — what day and time did it go live?
• Hook — how did the caption or video open?
The answers to these questions are your content strategy. Write them down. Build next week's plan around them.
💡 Pro Tip: Screenshot your top three posts every Friday. Keep a running log of what performs. After a month, you'll have a clear picture of your content formula, the specific combination of format, topic, tone, and timing that consistently works for your audience.
The 15-Minute Weekly Analytics Review
You don't need to spend hours in your analytics to get value from them. Here is a simple 15-minute weekly review you can run every Friday or Monday:
1. Open Analytics in Rooli. Set your date range to the past 7 days. Select All Platforms.
2. Check your four metric cards, are Total Followers, Total Impressions, and Engagement Growth up, down, or flat compared to last week?
3. Open Top Posts Metrics Comparison. What format and topic drove the most engagement this week?
4. Check Follower Growth. Did your audience grow this week? If yes — what happened? If no — what was missing?
5. Check Platform Performance Bar Chart. Which platform outperformed the others this week?
6. Open Top Performing Posts. Study your top 2-3 posts. Note the format, topic and tone.
7. Use what you've found to adjust next week's content plan, more of what worked, less of what didn't.
That's it. Fifteen minutes. Done every week, this habit compounds, each week's content is slightly smarter than the last, and your growth becomes more consistent over time.
Frequently Asked Questions
How often should I check my Rooli analytics?
Once a week is enough for most businesses and social media managers. A weekly review gives you enough data to spot patterns without getting lost in daily fluctuations that don't mean much. If you're running a specific campaign or launch, check daily for the duration of that campaign.
Can I filter analytics by a specific platform?
Yes. Use the platform filter buttons at the top of the Analytics page, All Platforms, Facebook, Instagram, Twitter/X, LinkedIn, or TikTok. Clicking any platform filters every chart and metric card to that platform only.
Can I set a custom date range for my analytics?
Yes. Use the From and To date fields at the top of the Analytics dashboard to set any date range you want, a single day, a specific week, a full month, or any custom period.
What does Engagement Growth actually measure?
Engagement Growth measures the change in total engagement, likes, comments, shares, saves, and clicks, during your selected date range compared to the previous equivalent period. A positive Engagement Growth number means your content is connecting better with your audience than it was before.
Can I see which individual posts performed best?
Yes. The Top Performing Posts section at the bottom of the Analytics dashboard shows your highest-activity content. Use the platform dropdown to filter by Facebook, Instagram, TikTok, LinkedIn, or Twitter/X to see top posts per platform.
Is white-label analytics reporting available?
Yes, for agencies on the Rocket plan. White-label analytics reports let you generate and send performance reports to clients with your own branding, not Rooli's. This is one of the most valuable features for agencies managing multiple client accounts professionally. Visit rooli.co/pricing to compare plans.
What if my analytics show zero data?
If your analytics are showing zero, it usually means one of two things: your connected accounts haven't had any posts published yet in the selected date range, or your social accounts were connected recently and the data hasn't populated yet. Make sure your accounts are properly connected in Social Accounts and that you have published posts within the date range you're reviewing.
Data in Hand. Now Let's Manage More Accounts.
You now know how to read your analytics, run a weekly review, and use your data to sharpen your content every week. The next step is scaling, managing multiple social media accounts or multiple clients from one Rooli dashboard, without losing your mind.
Up next: How to Manage Multiple Social Media Accounts in Nigeria with Rooli, workspaces, client separation, and staying organized at scale.
rooli.co • AI-Powered Social Media Management Built for Africa